In today’s fast-paced investment landscape, making confident decisions requires more than intuition. Investors and founders alike face mounting pressure to evaluate startups with accuracy, speed, and clarity yet incomplete or inconsistent data often obscures the true picture. Real-time dashboards, standardized reporting, and structured metrics like MRR/ARR, CAC/LTV, and churn are no longer optional; they are essential tools that transform raw numbers into actionable insight. When data transparency meets disciplined analysis, risk is reduced, and strategic choices become more reliable. But how can investors leverage these principles to consistently make smarter, data-driven decisions?
The Value of Dashboards and Structured KPIs
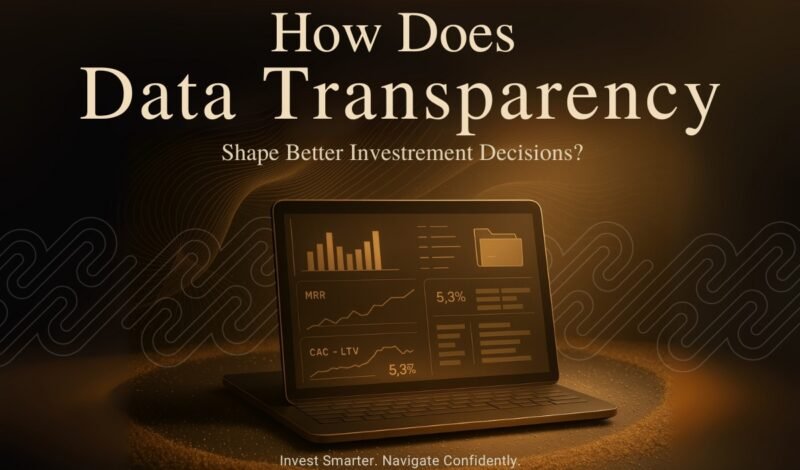
In the evolving world of investment, raw numbers alone rarely tell the full story. Investors must navigate vast streams of data from financial statements to customer behavior while distinguishing meaningful signals from noise. This is where dashboards and structured KPIs become indispensable: they organize and prioritize information, translating complexity into clarity. By centralizing the most critical metrics and presenting them in a digestible format, dashboards allow investors to quickly grasp a company’s performance landscape, identify growth opportunities, and assess potential risks. Before diving into the specifics of what dashboards are and why they matter, it’s essential to understand that their true value lies not just in visualization, but in enabling informed, data-driven decisions that reduce uncertainty and accelerate strategic action.
Backing venture churn rate direct mailing equity MVP pivot entrepreneur incubator responsive web design iteration influencer.
“In an era of information overload, transparency is not optional—it’s the foundation for confident, data-driven investment decisions.”
What Dashboards Are and Why They Matter
Dashboards serve as centralized platforms that consolidate and visualize key performance indicators (KPIs), enabling investors to monitor and analyze critical metrics in real time. These tools transform complex datasets into intuitive visual representations, facilitating quicker and more informed decision-making. By providing a comprehensive overview of a company’s performance, dashboards help investors identify trends, assess financial health, and make strategic choices with greater confidence.


Core Metrics Investors Care About — MRR/ARR, CAC/LTV, Churn, Tech Readiness
Investors focus on specific metrics to evaluate the viability and growth potential of startups:
- Monthly Recurring Revenue (MRR) / Annual Recurring Revenue (ARR): These metrics indicate the stability and predictability of a company’s revenue stream, which is crucial for assessing long-term profitability.
- Customer Acquisition Cost (CAC) / Lifetime Value (LTV): The ratio of LTV to CAC helps determine the efficiency of a company’s marketing and sales efforts, highlighting the return on investment in customer acquisition.
- Churn Rate: A high churn rate may signal customer dissatisfaction or product issues, while a low churn rate suggests strong customer retention and satisfaction.
- Technical Readiness: Evaluating a company’s technological infrastructure and scalability ensures that it can support growth and adapt to market demands.
These metrics provide investors with a quantitative basis for assessing a company’s performance and potential for growth.
Standardized Reporting and Consistent Data Rooms
Standardized reporting ensures that financial and operational data are presented consistently, allowing for easier comparison and analysis. Consistent data rooms, which securely house all relevant documents and information, provide transparency and facilitate due diligence processes. Together, standardized reporting and organized data rooms enhance trust and efficiency in investor relations, enabling stakeholders to access accurate and up-to-date information when needed.
Benefits of Real-Time Data and Standardized Reporting
In fast-moving investment environments, the speed and accuracy of information can determine the difference between success and missed opportunity. Investors no longer rely solely on periodic reports or static snapshots of performance; instead, they demand continuous, up-to-date insights that reflect the current state of a business. Real-time data, coupled with standardized reporting, ensures that key metrics are consistently captured, interpreted, and communicated across all stakeholders. This combination not only improves clarity but also strengthens confidence in decision-making, enhances forecasting accuracy, and fosters alignment across teams creating a foundation for strategic, data-driven investment choices.
Faster, More Confident Decisions
Access to real-time data empowers investors to make timely decisions, reducing the reliance on outdated information. This immediacy enhances confidence in decision-making, as investors can respond promptly to market changes and emerging opportunities.
Improved Forecasting and Risk Reduction
Real-time data allows for more accurate forecasting by providing current insights into market trends and company performance. This capability enables investors to anticipate potential risks and take proactive measures to mitigate them, thereby safeguarding investments.
Alignment Across Teams and Stakeholders
Standardized reporting and real-time data foster alignment among various teams and stakeholders by ensuring that everyone has access to the same information. This transparency promotes cohesive strategies and unified objectives, leading to more effective collaboration and decision-making.
The Limits and Risks of Over-Reliance on Data
While data transparency and structured metrics are critical for informed investment decisions, over-reliance on quantitative indicators can introduce its own set of challenges. Investors may face misleading signals, incomplete insights, or organizational obstacles that reduce the effectiveness of even the most robust dashboards. Understanding these limitations is essential to balance rigor with judgment and ensure that data serves as an enabler not a replacement for strategic thinking.
Pitfalls of Data and Metrics in Investment
Incomplete or Low-Quality Data and Bias
Data is only as valuable as its accuracy and completeness. Inconsistent reporting, missing entries, or poorly structured datasets can create blind spots, skewing investor perceptions. Biases may emerge from selective reporting or historical trends that no longer reflect current realities, leading to misguided decisions if not carefully validated.
Data Overload and “Analysis Paralysis”
The abundance of metrics can overwhelm decision-makers. When investors are confronted with too many indicators or overly complex dashboards, the risk of “analysis paralysis” rises, slowing decisions and potentially causing missed opportunities. Streamlining data to highlight decision-grade insights is critical to maintain efficiency.
Vanity Metrics vs. Decision-Grade Metrics
Not all metrics carry the same weight. While vanity metrics (e.g., total app downloads or page views) may appear impressive, they often fail to correlate with true business performance or long-term value. Investors must differentiate between attention-grabbing numbers and metrics that genuinely inform strategic investment choices, such as CAC/LTV ratios or churn trends.
Organizational and Cultural Barriers to Transparency
Cost and Time of Building Reliable Data Rooms
Implementing standardized data rooms requires substantial resources. Collecting, cleaning, and organizing information takes time and expertise, which can strain smaller startups or early-stage companies. Without dedicated effort, data rooms risk being incomplete or outdated, undermining their purpose.
Privacy, Security, and Legal Considerations
Sharing detailed financial or operational data introduces privacy and legal complexities. Investors and founders must navigate regulatory requirements, intellectual property protection, and confidentiality concerns to avoid unintended risks.
The Risk of Undermining Human Judgment
Finally, an overemphasis on metrics can inadvertently devalue human insight. Experienced investors often rely on qualitative factors: founder vision, market context, team dynamics—that numbers alone cannot capture. Balancing quantitative analysis with informed judgment remains a critical skill in effective decision-making.
Building a Balanced, Transparent, Data-Driven Investment Framework
After examining both the advantages and the limitations of data-driven investment approaches, the path forward lies in creating a framework that balances quantitative rigor with informed judgment. Startups and scale-ups that implement structured processes, appropriate technology, and clearly defined metrics are better positioned to attract investor confidence and reduce operational risk.
A Practical Roadmap for Startups and Scale-ups
Selecting the Right Metrics for the Business Model
Investors and founders must focus on metrics that directly reflect the business model and growth strategy. SaaS companies, for example, should prioritize MRR/ARR, CAC/LTV, and churn rates, while product-based startups may emphasize unit economics and customer retention metrics. Choosing the right KPIs ensures that decision-makers focus on meaningful data rather than vanity metrics, aligning operational efforts with strategic goals.
Implementing Real-Time BI Dashboards
Real-time business intelligence dashboards consolidate data from multiple sources and present actionable insights at a glance. These dashboards not only improve decision speed but also enhance forecasting accuracy and allow stakeholders to respond proactively to changing market conditions. A thoughtfully designed dashboard highlights decision-grade metrics while filtering out noise, preventing “analysis paralysis” and promoting strategic clarity.
Establishing Investor-Friendly Data Rooms
Standardized, well-organized data rooms give investors secure access to key financial, operational, and technical information. These repositories improve transparency, accelerate due diligence, and foster trust between founders and investors. Regular updates and clear documentation make data rooms a reliable tool for ongoing engagement, rather than a one-off compliance exercise.
Technology as an Enabler of Transparency
Advanced Dashboards, Automation, and Predictive Analytics
Modern technology automates data collection, reporting, and analysis, reducing human error and operational overhead. Predictive analytics allows investors to anticipate trends and potential risks, turning historical and current data into foresight that supports strategic decision-making.
AI-Assisted Transparency and Real-Time Insights
AI-assisted dashboards can detect anomalies, highlight growth opportunities, and generate scenario analyses, enabling faster, more confident investment decisions. By complementing human judgment, AI strengthens both the depth and speed of insight without replacing experienced analysis.
Case Studies of Successful Adoption
Several startups and scale-ups have successfully integrated advanced dashboards and standardized reporting, resulting in reduced fundraising cycles, better investor engagement, and improved operational alignment. While specific names may vary, the common thread is the disciplined application of structured metrics, transparency, and technology to drive measurable business outcomes.
Measuring the ROI of Data Transparency in Investment Decisions
Internal KPIs — Decision Speed, Forecast Accuracy, Investor Satisfaction
To evaluate the impact of transparency initiatives, organizations can track internal KPIs such as the time required to make strategic decisions, the accuracy of financial and operational forecasts, and investor satisfaction levels.
Benchmarking Before and After Transparency Initiatives
Comparing metrics before and after implementing structured reporting, dashboards, and data rooms helps quantify improvements and highlights areas needing adjustment. This benchmarking approach reinforces a culture of continuous learning and optimization.
Continuous Improvement and Feedback Loops
Transparency is not a one-time project; it requires ongoing monitoring, feedback, and iterative refinement. Incorporating lessons from past performance and stakeholder feedback ensures that data systems evolve with the business and continue to support strategic investment decisions.
Technology as an Enabler of Transparency
Advanced Dashboards, Automation, and Predictive Analytics
Modern technology automates data collection, reporting, and analysis, reducing human error and operational overhead. Predictive analytics allows investors to anticipate trends and potential risks, turning historical and current data into foresight that supports strategic decision-making.
AI-Assisted Transparency and Real-Time Insights
AI-assisted dashboards can detect anomalies, highlight growth opportunities, and generate scenario analyses, enabling faster, more confident investment decisions. By complementing human judgment, AI strengthens both the depth and speed of insight without replacing experienced analysis.
Case Studies of Successful Adoption
Several startups and scale-ups have successfully integrated advanced dashboards and standardized reporting, resulting in reduced fundraising cycles, better investor engagement, and improved operational alignment. While specific names may vary, the common thread is the disciplined application of structured metrics, transparency, and technology to drive measurable business outcomes.
“Structured metrics and real-time dashboards transform uncertainty into clarity, enabling investors to act swiftly, strategically, and with confidence.”
Conclusion
Data and transparency are more than operational conveniences; they are strategic enablers. When structured metrics, real-time dashboards, and standardized reporting are integrated thoughtfully, investors gain confidence, decision-making accelerates, and risks are mitigated.
For founders and investors alike, the recommendation is clear: invest in data infrastructure, prioritize meaningful metrics, and embrace technology that enhances transparency. The result is smarter, faster, and more informed investment decisions that position both startups and investors for long-term success.